What is Spurious Correlation in Statistics (With Examples)

In statistics, it’s common to encounter situations where two variables seem related yet lack a cause-and-effect relationship. This phenomenon can generate questions about the nature of statistical relationships and the reliability of your data interpretations.
Understanding this phenomenon becomes essential for any professional working with data, as it highlights the importance of in-depth analysis and critical thinking. In this article, you will explore spurious correlations and examples that will enable you to understand them thoroughly.
What is Spurious Correlation?
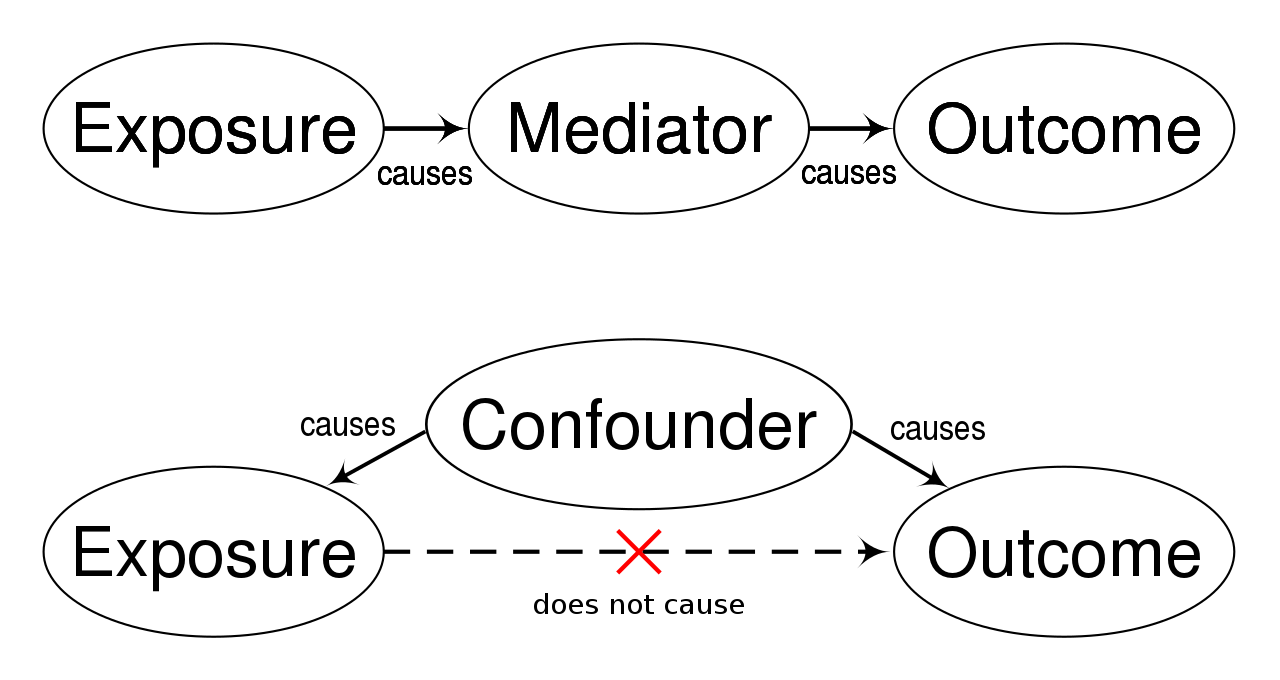
A spurious correlation in statistics occurs when two variables have a direct relationship, but a third variable influences both. The apparent relationship between the two variables does not reflect a cause-and-effect relationship.
This phenomenon may occur when the variables correlate by some random chance or when a third common variable influences both. Upon analysis, it may appear that one variable directly influences the other. Meanwhile, some underlying variables you didn’t consider during the evaluation process influence both the associated variables. Researchers often refer to the third variable as a confounding factor.
This situation highlights the importance of understanding, examining, and considering all potential influencing factors to interpret relationships between variables correctly.
What are the Key Differences Between Correlation and Causation?
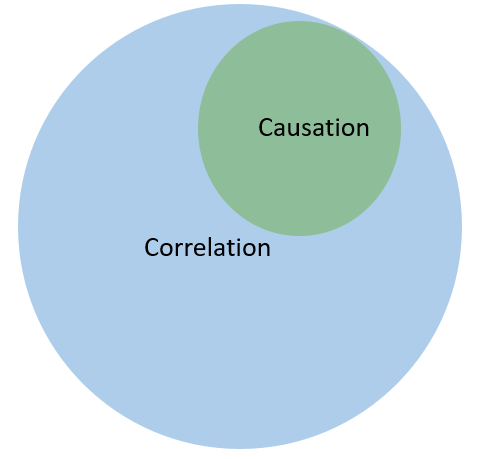
Correlation and Causation are two of the most important statistical terms used to identify data relationships. However, while they might sound the same, they have distinct functions. Here is the difference between correlation and causation:
Correlation is a statistical term that defines the relationship between two variables, indicating that changes in one variable influence the other. It does not explain the cause-and-effect relationship but simply highlights the relationship between variables, showcasing that they vary together in some way.
There can be three different types of correlation between variables:
- Positive correlation, where both the variables vary directly.
- Negative correlation, where both variables vary inversely.
- Zero correlation, where there is no relation between the variables.
Causation explains the cause-and-effect relationship between two variables, where one variable can change the other. Establishing causation requires further proof and evidence beyond the scope of correlational research.
For instance, consider the relationship between sugarcane production and sugar prices. If sugarcane production decreases in a year, sugar prices will rise. This example shows a direct cause-and-effect relationship between sugarcane production and sugar market price.
How to Identify Spurious Correlation?
The easiest way to identify spuriousness is to evaluate the relationship between variables with logical reasoning. It involves understanding the variables and guessing if there is any relationship between them. Apart from this method, statistical professionals also use other methods to evaluate spurious correlations. Here are a few of them:
- Ensuring a Representative Sample: The sample you use must accurately represent the population to reduce the sampling bias and generalize the findings beyond the scope of the sample. For instance, a study of productivity and coffee consumption for a corporation might lead to spuriousness if it doesn’t include employees from different departments.
- Ensure Satisfactory Sample Size: You must use a large sample to diminish misleading conclusions due to limited data. When you consider a large sample, the chances of valid correlations increase, decreasing the impact of false correlations.
- Being Cautious of Random Endpoints: Random endpoints denote outcomes that appear disconnected from the behavior of variables that you are studying. In certain types of studies, endpoints can serve as critical indicators. They can help you analyze whether the outcome under observation has a meaningful benefit within the research context.
- Controlling External Variables: Researchers must consider external variables to understand the relationship between variables thoroughly. By understanding the relationship between the dependent variables and external variables, you can identify whether the relationship is feasible or if there is a confounding correlation.
You can consider an example where a city experiences heavy rainfall. This weather condition leads to more people buying umbrellas while simultaneously increasing the number of accidents due to slippery surfaces. While umbrella sales and accidents might seem unrelated, they coincide with rainy weather, creating a confounding variable.
In this example, you can control the confounding variable or the rainy weather to reduce the impact of external factors. By controlling the external factor, you can model the relationship between the original variables you consider for the research.
- Applying Null Hypothesis: A null hypothesis explains no relationship between independent and dependent variables. This means altering the value of one variable will not influence the other variable. You can discard the null hypothesis if the correlation occurs for less than 5% of your total dataset samples.
To test theories and hypotheses, you can evaluate if the causal relationship between variables is coincidental or influenced by external confounding factors by examining the cause-and-effect relationship between them. This process involves investigating whether changes in one variable directly affect another, differentiating genuine relationships from spurious ones.
What are the Examples of Spurious Correlation?
You can consider multiple examples to check for spurious correlation. Here are a few spurious correlation examples that can help you better understand this concept:
- Air Conditioner Sales with Ice Cream Sales: If you observe ice cream sales increasing with air conditioner sales, you might identify a correlation between these two. However, in reality, they do not directly influence each other. The temperature of the day influences both variables and acts as a confounding factor.
- Number of Doctors in a Country and Chocolate Consumption: These two variables exhibit a positive correlation but do not have a causal relationship. A country’s economy affects both variables as it boosts them. Therefore, external factors truly influence these variables.
- Global Warming and Average Life Expectancy: Over time, both variables are positively correlated, yet they do not influence each other in any way. The impact of global warming lacks a direct correlation with average life expectancy. It indicates that some exogenous factors play a significant role in determining life expectancy trends.
- Number of PhD Applicants and Honey Production: Over the years, the total number of PhD applicants has drastically increased, and honey production has risen correspondingly. However, these two variables do not directly influence each other; multiple factors, such as population growth, GDP growth, and others, affect each one individually.
These examples illustrate the spuriousness that may occur while studying data through a statistical lens. The data considered in various studies usually combines multiple samples from different sources. Integrating data from multiple sources to a common destination can sometimes become a hassle. For this reason, organizations prefer to use SaaS-based data integration platforms. One such platform is Airbyte.
Streamline Data Integration with Airbyte

With Airbyte, you can use over 350 built-in connectors that support structured, semi-structured, and unstructured data. You can also integrate Airbyte with dbt, a robust data transformation tool that performs complex transformations. This integration allows you to manipulate and manage your data efficiently.
Here are some of the key benefits provided by Airbyte:
- Airbyte enables you to capture the changes made to the data from source to destination through Change Data Capture (CDC). This feature improves efficiency, especially when working with large datasets.
- You can utilize PyAirbyte, a Python-based library provided by Airbyte, to handle your data pipeline. It enables seamless data integration, allowing you to extract data from the source connector and transform it using Python.
- Airbyte prioritizes privacy and data security. Using its conduit offering, it achieves compliance with industry standards like GDPR, SOC 2, ISO certification, and HIPAA compliance.
Conclusion
A spurious correlation occurs when two variables appear to be correlated by their characteristics but do not influence each other. This can happen due to the inclusion of another confounding variable that influences both variables. Understanding the underlying principle behind this phenomenon may negatively alter the interpretation.
Spuriousness can occur if the sample you use for analysis is not representative of the population, the inclusion of a small sample size, or the influence of a random endpoint. You need to ensure that the relationship between the variables is causal by experimentation through statistical analysis.
The sample taken for the analysis must be representative of the population. To achieve a representative sample, you might have to integrate data from various sources. However, data integration from multiple sources can be complicated and require proper technical knowledge.
If you want to leverage the powers of a data integration platform and conduct seamless data transfer between different data sources, you can use Airbyte. This platform enables you to move data from multiple locations to a data pipeline and eventually to the destination of your preference.